Highest High Line with Multi-Timeframe Supertrend and RSIOverview:
This powerful indicator combines three essential elements for traders:
Highest High Line – Tracks the highest price over a customizable lookback period across different timeframes.
Multi-Timeframe Supertrend – Displays Supertrend values and trend directions for multiple timeframes simultaneously.
Relative Strength Index (RSI) – Shows RSI values across different timeframes for momentum analysis.
Features:
✅ Customizable Highest High Line:
Selectable timeframes: Daily, Weekly, Monthly, Quarterly, Yearly
Adjustable lookback period
✅ Multi-Timeframe Supertrend:
Supports 1min, 5min, 10min, 15min, 30min, 1H, Daily, Weekly, Monthly, Quarterly, Yearly
ATR-based calculation with configurable ATR period and multiplier
Identifies bullish (green) & bearish (red) trends
✅ Multi-Timeframe RSI:
Calculates RSI for the same timeframes as Supertrend
Overbought (≥70) and Oversold (≤30) signals with color coding
✅ Comprehensive Table Display:
A clean, structured table in the bottom-right corner
Displays Supertrend direction, value, and RSI for all timeframes
Helps traders quickly assess trend and momentum alignment
How to Use:
Use the Highest High Line to identify key resistance zones.
Confirm trend direction with Multi-Timeframe Supertrend.
Check RSI values to avoid overbought/oversold conditions before entering trades.
Align multiple timeframes for stronger confirmation of trend shifts.
Ideal For:
✅ Scalpers (lower timeframes: 1m–30m)
✅ Swing Traders (higher timeframes: 1H–D)
✅ Position Traders (Weekly, Monthly, Quarterly)
💡 Tip: Look for Supertrend & RSI confluence across multiple timeframes for higher probability setups.
"Relative Strength Index (RSI) " için komut dosyalarını ara

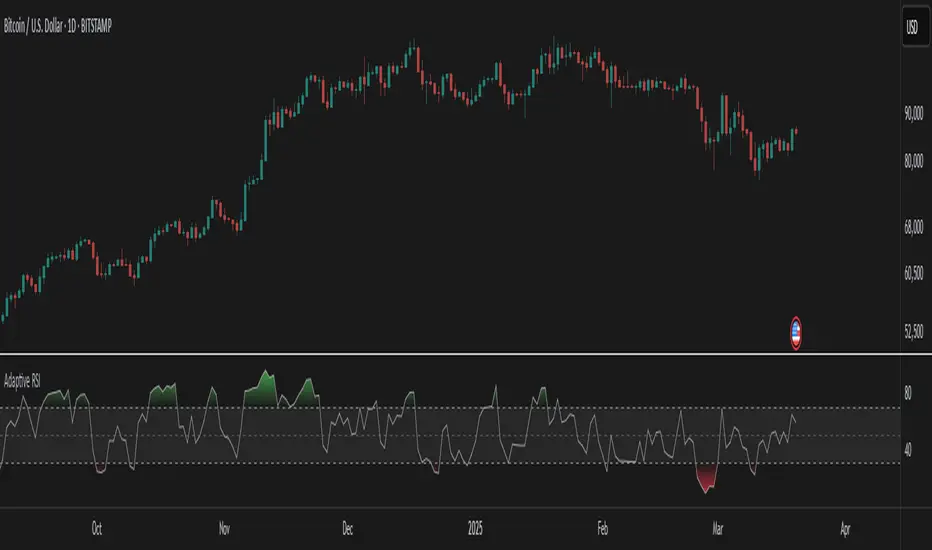
Ehlers Adaptive RSIThe Ehlers Adaptive RSI improves on the traditional RSI by dynamically adjusting its period based on market conditions.
Problem with the Classic RSI:
The traditional Relative Strength Index (RSI) uses a fixed period (e.g., 14), making it slow to react in volatile markets and too sensitive in stable conditions.
How the Adaptive RSI Solves This:
Instead of a fixed period, this version automatically adapts based on market volatility using a combination of ATR (Average True Range) and EMA (Exponential Moving Average).
Key Benefits:
More Responsive – Quickly adapts to market shifts, reducing lag.
Less Noise – Filters out unnecessary fluctuations in stable trends.
Self-Adjusting – No need to manually change RSI settings for different market conditions.
Better Signal Accuracy – Helps detect real trend reversals without false alarms.
This script is for informational and educational purposes only. It does not constitute financial advice, and past performance does not guarantee future results. Use it at your own risk.
MACD Sniper [trade_lexx]📈 MACD Sniper — Improve your trading strategy with accurate signals!
Introducing the MACD Sniper , an advanced trading indicator designed for a comprehensive analysis of market conditions. This indicator combines MACD (Moving Average Convergence Divergence) with various types of moving averages (SMA, EMA, WMA, VWMA, KAMA, HMA, ZLEMA, TEMA, ALMA, DEMA), providing traders with a powerful tool for generating buy and sell signals. It is ideal for traders who need an advantage in detecting changes in trends and market conditions.
🔍 How the signals work
1. Histogram signals:
— A buy signal is generated when the MACD histogram is below zero and begins to grow after the minimum number of falling histogram columns, which are indicated in the indicator menu. This indicates that selling pressure has decreased, the market is oversold and ready for a rebound. The signals are displayed as green triangles labeled "H" under the histogram graph. On the main chart, buy signals are displayed as green triangles labeled "Buy" under candlesticks.
— A sell signal is generated when the MACD histogram is above zero and begins to fall after the minimum number of growing histogram columns, which are indicated in the indicator menu. This indicates that the buying pressure has decreased, the market is overbought and ready for correction. The signals are displayed as red triangles labeled "H" above the histogram graph. On the main chart, the sell signals are displayed as red triangles with the word "Sell" above the candlesticks.
2. Moving Average Crossing Signals (MA):
— A buy signal is generated when the Fast Moving Average (MACD) crosses the Slow Moving Average (Signal Line) from bottom to top. This indicates a possible upward reversal of the market. The signals are displayed as green triangles labeled "MA" under the MACD chart. On the main chart, buy signals are displayed as green triangles labeled "Buy" under candlesticks.
— A sell signal is generated when the Fast Moving Average (MACD) crosses the slow Moving Average (Signal Line) from top to bottom. This indicates a possible downward reversal of the market. The signals are displayed as red triangles labeled "MA" above the MACD chart. On the main chart, the sell signals are displayed as red triangles with the word "Sell" above the candlesticks.
🔧 Signal filtering
— Minimum number of bars between signals
This filter allows the user to set the minimum number of bars that must pass between the generation of two consecutive signals. This helps to avoid frequent false alarms and improves the quality of the generated signals. Setting this parameter allows you to filter out the noise in the market and make the signals more reliable. For example, if the value is set to 5, then a new signal will be generated only after 5 bars have passed since the previous signal.
— "Wait for the opposite signal" mode
In this mode, Buy and Sell signals are generated only after receiving the opposite signal. This means that a buy signal will be generated only after the previous sell signal, and vice versa. This approach adds an additional level of filtering and helps to avoid false positives. This is especially useful in conditions of high market volatility, when false signals often occur.
— RSI filter
The Relative Strength Index (RSI) is used for additional filtering of buy and sell signals. The RSI helps determine whether a market is overbought or oversold. The user can set overbought and oversold levels, and signals will be generated only when the RSI is in the specified ranges. For example, a buy signal will be generated only if the RSI is in the range between 10 and 30 (oversold), and a sell signal if the RSI is in the range between 70 and 90 (overbought). This helps to avoid false signals in extreme market conditions.
🔌 Connector Histogram, MA, Combined 🔌
These parameters allow you to connect the indicator to trading strategies and test the signals throughout the trading history. This makes the indicator an even more powerful tool for traders who want to test the effectiveness of their strategies on historical data.
Connector Histogram provides the ability to connect signals based on the MACD histogram to trading strategies.
Connector MA allows you to connect signals based on the intersection of moving averages (MA) of the MACD, which can also be used for automatic trading or strategy testing.
The combined connector combines signals based on both a histogram and the intersection of moving averages, making the analysis more comprehensive and reliable, which is especially useful for traders seeking to improve the quality of their trading decisions.
🔔 Alerts
The indicator provides the ability to set up notifications for buy and sell signals, which allows traders to keep abreast of important market events without having to constantly monitor the chart. Users can set up notifications that will alert them when buy or sell signals appear, helping them respond to market changes in a timely manner and make informed decisions. These notifications can be configured for various types of signals, such as signals based on the MACD histogram, moving average crossings, or all at once, which makes the indicator a more convenient and functional tool for active traders.
🎨 Customizable Appearance
Customize the appearance of the MACD Sniper according to your preferences to make the analysis more convenient and visually pleasing. In the indicator settings section, you can change the colors of the buy and sell signals so that they stand out on the chart and are easily visible. For example, buy signals can be green, and sell signals can be red. These settings allow traders to adapt the indicator to their individual needs, making it more flexible and user-friendly.
🔧 How it works
The MACD Sniper indicator starts by calculating the MACD values and moving averages for a specific period in order to assess market conditions. For this, fast and slow moving averages are used, as well as a signal line, which are calculated based on the set parameters. The indicator then analyzes the MACD histogram to determine whether the difference between the fast and slow moving averages is rising or falling. Based on this analysis, buy and sell signals are generated. Additionally, the indicator uses the RSI filter to filter out false signals in overbought or oversold market conditions. The user can set the minimum number of bars between the signals and the "Wait for the opposite signal" mode for additional filtering. The indicator dynamically adjusts to changes in the market, providing relevant signals in real time.
📚 Quick guide to using the MACD Sniper
— Add the indicator to your favorites by clicking on the rocket icon. Adjust the parameters such as the length of periods for fast and slow moving averages, the type of moving average (SMA, EMA, WMA, VWMA, KAMA, HMA, ZLEMA, TEMA, ALMA, DEMA) and the length of the signal line, according to your trading style, or leave all settings as default.
— Adjust the signal filters to improve their quality and avoid false alarms
— Turn on notifications so that you don't miss important trading opportunities and don't constantly sit at the chart. This will allow you to keep abreast of all key market events and respond to them in a timely manner, without being distracted from other business.
— Use signals, they will help you determine the optimal entry and exit points of positions.
— Use the Connector for deeper analysis and verification of the effectiveness of signals, connect them to your trading strategies. This will allow you to test signals throughout your trading history and evaluate their accuracy based on historical data.
— Include the indicator in your trading strategy and run testing to see how buy and sell signals have worked in the past.
— Analyze the test results to determine how reliable the signals are and how they can improve your trading strategy. This will help you make more informed decisions and increase your trading efficiency.

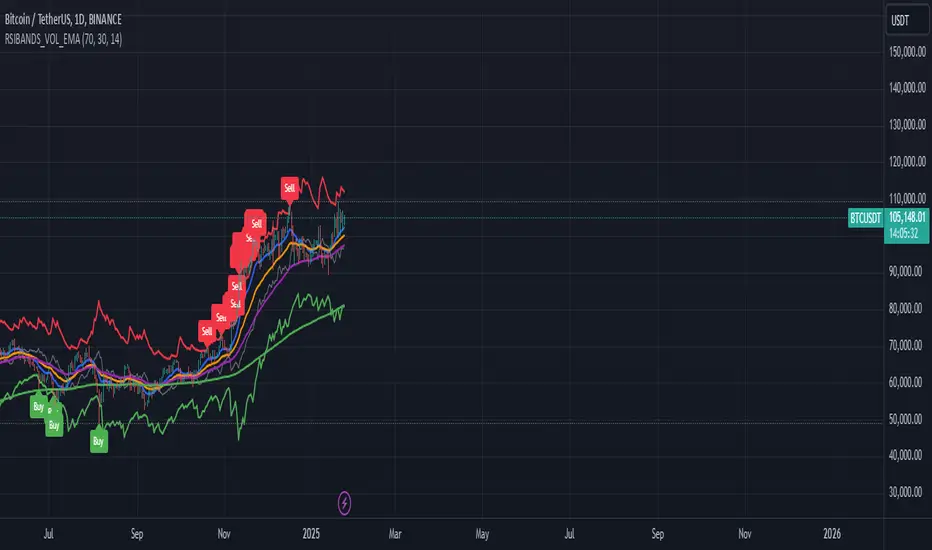
RSI Bands with Volume and EMAThis script is a comprehensive technical analysis tool designed to help traders identify key market signals using RSI bands, volume, and multiple Exponential Moving Averages (EMAs). It overlays the following on the chart:
RSI Bands: The script calculates and plots two bands based on the Relative Strength Index (RSI), indicating overbought and oversold levels. These bands act as dynamic support and resistance zones:
Resistance Band (Upper Band): Plotted when the RSI exceeds the overbought level, typically indicating a potential sell signal.
Support Band (Lower Band): Plotted when the RSI falls below the oversold level, typically indicating a potential buy signal.
Midline: The average of the upper and lower bands, acting as a neutral reference.
Buy/Sell Labels: Labels are dynamically added to the chart when price reaches the overbought or oversold levels.
A "Buy" label appears when the price reaches the oversold (lower) band.
A "Sell" label appears when the price reaches the overbought (upper) band.
Volume Indicator: The script visualizes trading volume as histograms, with red or green bars representing decreasing or increasing volume, respectively. The volume height is visually reduced for better clarity and comparison.
Exponential Moving Averages (EMAs): The script calculates and plots four key EMAs (12, 26, 50, and 200) to highlight short-term, medium-term, and long-term trends:
EMA 12: Blue
EMA 26: Orange
EMA 50: Purple
EMA 200: Green
The combined use of RSI, volume, and EMAs offers traders a multi-faceted view of the market, assisting in making informed decisions about potential price reversals, trends, and volume analysis. The script is particularly useful for identifying entry and exit points on charts like BTC/USDT, although it can be applied to any asset.
Multiple Values TableThis Pine Script indicator, named "Multiple Values Table," provides a comprehensive view of various technical indicators in a tabular format directly on your trading chart. It allows traders to quickly assess multiple metrics without switching between different charts or panels.
Key Features:
Table Position and Size:
Users can choose the position of the table on the chart (e.g., top left, top right).
The size of the table can be adjusted (e.g., tiny, small, normal, large).
Moving Averages:
Calculates the 5-day Exponential Moving Average (5DEMA) using daily data.
Calculates the 5-week and 20-week EMAs (5WEMA and 20WEMA) using weekly data.
Indicates whether the current price is above or below these moving averages in percentage terms.
Drawdown and Williams VIX Fix:
Computes the drawdown from the 365-day high to the current close.
Calculates the Williams VIX Fix (WVF), which measures the volatility of the asset.
Shows both the current WVF and a 2% drawdown level.
Relative Strength Index (RSI):
Displays the current RSI and compares it to the RSI from 14 days ago.
Indicates whether the RSI is increasing, decreasing, or flat.
Stochastic RSI:
Computes the Stochastic RSI and compares it to the value from 14 days ago.
Indicates whether the Stochastic RSI is increasing, decreasing, or flat.
Normalized MACD (NMACD):
Calculates the Normalized MACD values.
Indicates whether the MACD is increasing, decreasing, or flat.
Awesome Oscillator (AO):
Calculates the AO on a daily timeframe.
Indicates whether the AO is increasing, decreasing, or flat.
Volume Analysis:
Displays the average volume over the last 22 days.
Shows the current day's volume as a percentage of the average volume.
Percentile Calculations:
Calculates the current percentile rank of the WVF and ATH over specified periods.
Indicates the percentile rank of the current volume percentage over the past period.
Table Display:
All these values are presented in a neatly formatted table.
The table updates dynamically with the latest data.
Example Use Cases:
Comprehensive Market Analysis: Quickly assess multiple indicators at a glance.
Trend and Momentum Analysis: Identify trends and momentum changes based on various moving averages and oscillators.
Volatility and Drawdown Monitoring: Track volatility and drawdown levels to manage risk effectively.
This script offers a powerful tool for traders who want to have a holistic view of various technical indicators in one place. It provides flexibility in customization and a user-friendly interface to enhance your trading experience.

TRENDSYNC BUY/SELL BY SIMPLY_DANTE-FXTrendSync Buy and Sell Indicator
PS: Kindly give me feedback on the comment section, I will really appriciate
Created By: Simply_Dante-FX
About the Author:
Simply_Dante-FX is a skilled trader and developer with a focus on creating custom indicators and strategies for technical analysis. With a strong understanding of market behavior, he has designed the TrendSync Buy and Sell indicator to help traders identify high-probability buy and sell signals based on a combination of trend-following, momentum, and price action strategies. Simply_Dante-FX aims to provide tools that enhance trading decisions and improve the overall trading experience.
---
Description:
The TrendSync Buy and Sell indicator is designed to help traders identify potential buy and sell signals based on a combination of trend-following and momentum-based strategies. This custom indicator combines a range of technical tools, including the Simple Moving Average (SMA), Average True Range (ATR), and the Relative Strength Index (RSI), to filter and confirm entry points.
---
How It Works:
1. Trend Identification (SMA):
- The indicator uses the 200-period Simple Moving Average (SMA) to determine the overall trend direction.
- A Buy Signal is generated when the price is above the SMA, indicating an uptrend.
- A Sell Signal is generated when the price is below the SMA, indicating a downtrend.
2. Range Filtering (ATR):
- The Average True Range (ATR) is used to filter out signals that occur during periods of low volatility.
- The ATR is multiplied by a user-defined range filter multiplier (default is 1.2) to ensure the signal is coming from a sufficiently volatile market condition.
3. Momentum Confirmation (RSI):
- The RSI is used as a momentum filter. For Buy Signals, the RSI must be above the user-defined threshold (default is 50), indicating bullish momentum.
- For Sell Signals, the RSI must be below the opposite threshold (100 - RSI Threshold), indicating bearish momentum.
4.Price Action Conditions:
- Buy and Sell signals are further confirmed by price action:
- Buy Signal: Identifies higher lows during an uptrend.
- Sell Signal: Identifies higher highs during an uptrend, or lower highs in a downtrend.
5. Unified Signal:
- The script combines the various conditions to generate a unified signal, ensuring that only high-probability trade opportunities are highlighted.
How to Use It:
1.Buy Signal: Look for a green label below the bar, which indicates a potential buying opportunity. This signal is generated when:
- The price is above the 200-period SMA (uptrend).
- The RSI is above the defined threshold (momentum confirmation).
- The ATR-based range filter confirms sufficient market movement.
2. Sell Signal: Look for a red label above the bar, which indicates a potential selling opportunity. This signal is generated when:
- The price is below the 200-period SMA (downtrend).
- The RSI is below the defined threshold (momentum confirmation).
- The ATR-based range filter confirms sufficient market movement.
3. Visual Confirmation: The script also plots the 200-period SMA for easy identification of the overall trend direction.
4.Alert Setup: You can set up an alert using the “Unified Buy/Sell Alert” condition to notify you when a buy or sell signal is triggered.
Disclaimer:
- Risk Warning: The TrendSync Buy and Sell indicator is a tool for technical analysis and is not a guaranteed method for predicting market movements. Trading carries risk, and it is essential to use proper risk management techniques and not rely solely on any one indicator.
- No Financial Advice: This indicator does not constitute financial advice, and the author, Simply_Dante-FX, does not take responsibility for any trading losses or profits resulting from the use of this tool.
- Performance: Past performance is not indicative of future results. Always conduct your own analysis and use additional tools and strategies to confirm trade decisions.
Use this indicator with caution, and always ensure that you understand the risks involved in trading before committing real capital.

Bollinger Bands + RSI StrategyThe Bollinger Bands + RSI strategy combines volatility and momentum indicators to spot trading opportunities in intraday settings. Here’s a concise summary:
Components:
Bollinger Bands: Measures market volatility. The lower band signals potential buying opportunities when the price is considered oversold.
Relative Strength Index (RSI): Evaluates momentum to identify overbought or oversold conditions. An RSI below 30 indicates oversold, suggesting a buy, and above 70 indicates overbought, suggesting a sell.
Strategy Execution:
Buy Signal : Triggered when the price falls below the lower Bollinger Band while the RSI is also below 30.
Sell Signal : Activated when the price exceeds the upper Bollinger Band with an RSI above 70.
Exit Strategy : Exiting a buy position is considered when the RSI crosses back above 50, capturing potential rebounds.
Advantages:
Combines price levels with momentum for more reliable signals.
Clearly defined entry and exit points help minimize emotional trading.
Considerations:
Can produce false signals in very volatile or strongly trending markets.
Best used in markets without a strong prevailing trend.
This strategy aids traders in making decisions based on technical indicators, enhancing their ability to profit from short-term price movements.

Price Movement Predictor (PMP)The Price Movement Predictor (PMP) is a versatile trading indicator designed to assist traders in identifying potential buy and sell opportunities in the market. This indicator utilizes a combination of technical analysis tools to generate signals based on the relative strength index (RSI) and moving averages, ensuring a robust and strategic approach to trading.
Key Features:
RSI-Based Signal Generation:
The indicator monitors the RSI to identify overbought and oversold conditions in the market.
A buy signal is generated when the RSI drops below a predefined oversold threshold, indicating potential upward price movement.
Conversely, a sell signal is triggered when the RSI exceeds a specified overbought level, suggesting a possible price decline.
Moving Average Confirmation:
The indicator employs two moving averages: a short-term and a long-term moving average.
Buy and sell signals are confirmed only after a crossover event occurs, ensuring that trades are entered in alignment with market trends.
The short moving average crossing above the long moving average confirms a buy signal, while a crossover below confirms a sell signal.
Take Profit and Stop Loss Management:
The PMP includes adjustable take profit and stop loss levels, which are automatically calculated based on user-defined percentages.
Labels indicating the take profit (TP) and stop loss (SL) levels are plotted on the chart, helping traders manage their risk effectively.
Alerts are available for both TP and SL conditions, allowing traders to stay informed about their trade outcomes.
User-Friendly Interface:
The indicator provides an intuitive setup with adjustable parameters for moving average lengths, RSI levels, and TP/SL ratios.
Clear buy and sell signals are displayed directly on the chart, making it easy for traders to act on potential opportunities.
Usage:
The Price Movement Predictor is ideal for traders who seek a systematic approach to identify trading opportunities and manage risk. By combining RSI signals with moving average crossovers, the indicator helps filter out false signals and enhances the accuracy of trade entries. It is suitable for various trading styles, including day trading, swing trading, and long-term investing.

Power Root SuperTrend [AlgoAlpha]📈🚀 Power Root SuperTrend by AlgoAlpha - Elevate Your Trading Strategy! 🌟
Introducing the Power Root SuperTrend by AlgoAlpha, an advanced trading indicator that enhances the traditional SuperTrend by incorporating Root-Mean-Square (RMS) calculations for a more responsive and adaptive trend detection. This innovative tool is designed to help traders identify trend directions, potential take-profit levels, and optimize entry and exit points with greater accuracy, making it an excellent addition to your trading arsenal.
Key Features:
🔹 Root-Mean-Square SuperTrend Calculation : Utilizes the RMS of closing prices to create a smoother and more sensitive SuperTrend line that adapts quickly to market changes.
🔸 Multiple Take-Profit Levels : Automatically calculates and plots up to seven take-profit levels (TP1 to TP7) based on market volatility and the change in SuperTrend values.
🟢 Dynamic Trend Coloring : Visually distinguish between bullish and bearish trends with customizable colors for clearer market visualization.
📊 RSI-Based Take-Profit Signals : Incorporates the Relative Strength Index (RSI) of the distance between the price and the SuperTrend line to generate additional take-profit signals.
🔔 Customizable Alerts : Set alerts for trend direction changes, achievement of take-profit levels, and RSI-based take-profit conditions to stay informed without constant chart monitoring.
How to Use:
Add the Indicator : Add the indicator to favorites by pressing the ⭐ icon or search for "Power Root SuperTrend " in the TradingView indicators library and add it to your chart. Adjust parameters such as the ATR multiplier, ATR length, RMS length, and RSI take-profit length to suit your trading style and the specific asset you are analyzing.
Analyze the Chart : Observe the SuperTrend line and the plotted take-profit levels. The color changes indicate trend directions—green for bullish and red for bearish trends.
Set Alerts : Utilize the built-in alert conditions to receive notifications when the trend direction changes, when each TP level is drawn, or when RSI-based take-profit conditions are met.
How It Works:
The Power Root SuperTrend indicator enhances traditional SuperTrend calculations by applying a Root-Mean-Square (RMS) function to the closing prices, resulting in a more responsive trend line that better reflects recent price movements. It calculates the Average True Range (ATR) to determine the volatility and sets the upper and lower SuperTrend bands accordingly. When a trend direction change is detected—signified by the SuperTrend line switching from above to below the price or vice versa—the indicator calculates the change in the SuperTrend value. This change is then used to establish multiple take-profit levels (TP1 to TP7), each representing incremental targets based on market volatility. Additionally, the indicator computes the RSI of the distance between the current price and the SuperTrend line to generate extra take-profit signals when the RSI crosses under a specific threshold. The combination of RMS calculations, multiple TP levels, dynamic coloring, and RSI signals provides traders with a comprehensive tool for identifying trends and optimizing trade exits. Customizable alerts ensure that traders can stay updated on important market developments without needing to constantly watch the charts.
Elevate your trading strategy with the Power Root SuperTrend indicator and gain a smarter edge in the markets! 🚀✨

Harmony Signal Flow By ArunThis Pine Script strategy, titled "Harmony Signal Flow By Arun," uses the Relative Strength Index (RSI) indicator to generate buy and sell signals based on custom thresholds. The script incorporates stop-loss and target management and restricts new trades until the previous position closes. Here's a detailed description:
Custom RSI Metric:
The strategy calculates a 5-period RSI based on the closing price, aiming for a more responsive measure of price momentum.
RSI thresholds are defined:
Lower threshold (30): Indicates oversold conditions, triggering a potential buy.
Upper threshold (70): Indicates overbought conditions, prompting a possible sell.
Entry Conditions:
Buy Signal: The strategy initiates a buy order when the RSI crosses above the lower threshold (30), indicating a shift from oversold conditions.
Sell Signal: A sell order is triggered when the RSI crosses below the upper threshold (70), suggesting an overbought reversal.
Only one order (buy or sell) can be active at a time, ensuring that a new trade begins only when there’s no existing position.
Stop-Loss and Target Management:
For each trade, stop-loss and target conditions are applied to manage risk and secure profits.
For Buy Positions:
Stop-loss is set 100 points below the entry price.
Target is set 150 points above the entry price.
For Sell Positions:
Stop-loss is set 100 points above the entry price.
Target is 150 points below the entry price.
The strategy closes the trade when either the stop-loss or target is met, marking the trade as "closed" and allowing a new trade entry.
Trade Sequencing:
A new trade (buy or sell) is only permitted after the previous position hits either its stop-loss or target, preventing overlapping trades and ensuring clear trade sequences.
This sequential approach enhances risk management by ensuring only one active position at any time.
End-of-Day Closure:
All open positions are closed automatically at 3:25 PM (Indian market time) to avoid overnight exposure, ensuring the strategy remains strictly intraday.
The flag for trade entry is reset at the end of each day, enabling fresh trades the next day.
Chart Indicators:
The script plots buy and sell signals directly on the chart with visible labels.
It also displays the custom RSI metric with horizontal lines for the lower and upper thresholds, providing visual cues for entry and exit points.
Summary
This strategy is a momentum-based intraday trading approach that uses the RSI for identifying potential reversals and manages trades through predefined stop-loss and target levels. By enforcing trade sequencing and closing positions at the end of the trading day, it prioritizes risk management and seeks to capitalize on short-term trends while avoiding overnight market risks.

Stochastic Trendlines with Breakouts [Jamshid] - EnhancedStochastic Trendlines with Breakouts - Enhanced Version
This advanced Stochastic Trendlines with Breakouts script combines several powerful features to provide enhanced breakout detection based on the Stochastic Oscillator and additional confirmation signals. This script is designed to help traders identify key trend reversals, breakout points, and pivot levels with more accuracy by integrating advanced filters such as RSI confirmation, moving average trend filtering, volatility filtering, divergence detection, and multi-timeframe analysis.
Key Features:
Stochastic Oscillator-Based Breakouts:
Automatically detects breakouts based on the smoothed Stochastic Oscillator values (%K and %D), providing insights into overbought and oversold conditions.
Customizable overbought and oversold levels, with a mid-level (50) line for additional reference.
Trendlines on Pivot Points:
Automatically plots dynamic trendlines based on pivot highs and lows of the smoothed Stochastic %K, helping to visualize potential reversal points.
RSI Confirmation (Optional):
Filters breakout signals using the Relative Strength Index (RSI) to confirm breakouts only when the RSI is below 50 for downtrend breakouts and above 50 for uptrend breakouts.
Visual confirmation with a green "RSI Conf." label displayed on the chart when the RSI condition is met.
Moving Average Filter (Optional):
Confirms breakout signals in the direction of a user-defined Moving Average (MA) to trade in the overall market trend direction.
MA length is fully customizable.
Stochastic Divergence Filter (Optional):
Detects bullish or bearish divergence between the price and Stochastic Oscillator values, adding an extra layer of confirmation.
Multi-Timeframe Confirmation (Optional):
Confirms breakouts by checking the Stochastic %K and %D values from a higher timeframe. This helps in avoiding false signals by aligning with the broader market trend.
The higher timeframe can be customized to any timeframe (e.g., daily, weekly, etc.).
Volatility Filter (Optional):
Uses the ATR (Average True Range) to filter out breakouts during periods of low volatility, ensuring signals are only triggered when there is sufficient price movement.
ATR length and multiplier are fully customizable.
Custom Alerts:
Alerts are available for new trendline detections (both pivot high and pivot low) and for confirmed breakout signals. These alerts help traders stay informed in real-time without needing to monitor the chart continuously.
How to Use:
Customize the Stochastic Oscillator settings, such as %K smoothing and %D line parameters, to fit your trading strategy.
Enable or disable additional filtering features (RSI, MA, divergence, MTF, volatility) as needed.
Set up alerts for specific breakout conditions directly in TradingView to stay notified when breakout signals are triggered.
This script is designed for traders who are looking for precision breakout signals with added layers of confirmation to avoid false breakouts and enhance trading accuracy.

TPS Short Strategy by Larry ConnersThe TPS Short strategy aims to capitalize on extreme overbought conditions in an ETF by employing a scaling-in approach when certain technical indicators signal potential reversals. The strategy is designed to short the ETF when it is deemed overextended, based on the Relative Strength Index (RSI) and moving averages.
Components:
200-Day Simple Moving Average (SMA):
Purpose: Acts as a long-term trend filter. The ETF must be below its 200-day SMA to be eligible for shorting.
Rationale: The 200-day SMA is widely used to gauge the long-term trend of a security. When the price is below this moving average, it is often considered to be in a downtrend (Tushar S. Chande & Stanley Kroll, "The New Technical Trader: Boost Your Profit by Plugging Into the Latest Indicators").
2-Period RSI:
Purpose: Measures the speed and change of price movements to identify overbought conditions.
Criteria: Short 10% of the position when the 2-period RSI is above 75 for two consecutive days.
Rationale: A high RSI value (above 75) indicates that the ETF may be overbought, which could precede a price reversal (J. Welles Wilder, "New Concepts in Technical Trading Systems").
Scaling-In Mechanism:
Purpose: Gradually increase the short position as the ETF price rises beyond previous entry points.
Scaling Strategy:
20% more when the price is higher than the first entry.
30% more when the price is higher than the second entry.
40% more when the price is higher than the third entry.
Rationale: This incremental approach allows for an increased position size in a worsening trend, potentially increasing profitability if the trend continues to align with the strategy’s premise (Marty Schwartz, "Pit Bull: Lessons from Wall Street's Champion Day Trader").
Exit Conditions:
Criteria: Close all positions when the 2-period RSI drops below 30 or the 10-day SMA crosses above the 30-day SMA.
Rationale: A low RSI value (below 30) suggests that the ETF may be oversold and could be poised for a rebound, while the SMA crossover indicates a potential change in the trend (Martin J. Pring, "Technical Analysis Explained").
Risks and Considerations:
Market Risk:
The strategy assumes that the ETF will continue to decline once shorted. However, markets can be unpredictable, and price movements might not align with the strategy's expectations, especially in a volatile market (Nassim Nicholas Taleb, "The Black Swan: The Impact of the Highly Improbable").
Scaling Risks:
Scaling into a position as the price increases may increase exposure to adverse price movements. This method can amplify losses if the market moves against the position significantly before any reversal occurs.
Liquidity Risk:
Depending on the ETF’s liquidity, executing large trades in increments might affect the price and increase trading costs. It is crucial to ensure that the ETF has sufficient liquidity to handle large trades without significant slippage (James Altucher, "Trade Like a Hedge Fund").
Execution Risk:
The strategy relies on timely execution of trades based on specific conditions. Delays or errors in order execution can impact performance, especially in fast-moving markets.
Technical Indicator Limitations:
Technical indicators like RSI and SMA are based on historical data and may not always predict future price movements accurately. They can sometimes produce false signals, leading to potential losses if used in isolation (John Murphy, "Technical Analysis of the Financial Markets").
Conclusion
The TPS Short strategy utilizes a combination of long-term trend filtering, overbought conditions, and incremental shorting to potentially profit from price reversals. While the strategy has a structured approach and leverages well-known technical indicators, it is essential to be aware of the inherent risks, including market volatility, liquidity issues, and potential limitations of technical indicators. As with any trading strategy, thorough backtesting and risk management are crucial to its successful implementation.

Enhanced Overbought/Oversold IndicatorEnhanced Overbought/Oversold Indicator
Description:
The Enhanced Overbought/Oversold Indicator is a custom technical analysis tool designed to identify potential reversal points in the market by highlighting conditions of overbought and oversold levels on any timeframe. This indicator is based on the Relative Strength Index (RSI), a momentum oscillator that measures the speed and change of price movements.
Features:
Overbought & Oversold Levels:
Overbought (RSI > 70): Indicates that the market is potentially overvalued and might be due for a pullback. The candles are highlighted in Red to signal caution.
Oversold (RSI < 30): Indicates that the market is potentially undervalued and might be due for a bounce. The candles are highlighted in Green to signal potential buying opportunities.
Extreme Conditions:
Extreme Overbought (RSI > 85): Indicates an extremely overbought condition, suggesting a very high likelihood of a reversal or correction. The candles are highlighted in Blue.
Extreme Oversold (RSI < 15): Indicates an extremely oversold condition, suggesting a strong potential for a reversal upwards. The candles are highlighted in Yellow.
Dynamic Highlighting:
The indicator dynamically adjusts the candle colors based on the current RSI value, providing a clear visual representation of market conditions.
Applications:
Trend Reversals: By identifying extreme RSI levels, the indicator helps traders anticipate possible trend reversals.
Entry & Exit Points: Traders can use the highlighted signals to make more informed decisions about entering or exiting trades.
Risk Management: The color-coded signals can be used to manage risk, especially during extreme market conditions.
This indicator is particularly useful for traders looking for a straightforward visual representation of market conditions across different timeframes. By combining standard and extreme RSI levels, it helps identify not just overbought and oversold conditions but also extreme levels where significant reversals are more likely.

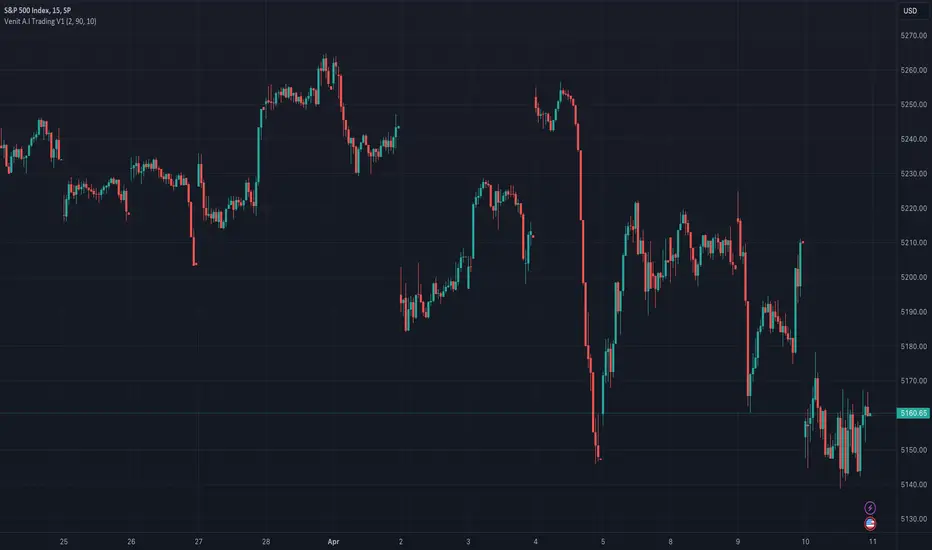
Venit A.I Trading V1RSI indicatorThis indicator is designed to provide buy and sell signals based on the Relative Strength Index (RSI). Here's a breakdown of its components and functionality:
1. **Input Parameters**:
- `Period`: This parameter allows the user to adjust the period used in calculating the RSI.
- `Upper Threshold` and `Lower Threshold`: These parameters define the overbought and oversold levels for the RSI.
- `Imverse Algorithm`: This parameter allows the user to toggle between different algorithms for generating buy and sell signals.
- `Show Lines`: This parameter toggles the visibility of lines on the chart indicating buy and sell signals.
- `Show Labels`: This parameter toggles the visibility of labels on the chart indicating buy and sell signals.
2. **RSI Calculation**:
- The RSI is calculated using the specified period (`myPeriod`), typically representing the closing prices of the asset.
3. **Buy and Sell Conditions**:
- Buy conditions are determined based on whether the RSI crosses below the lower threshold (`myThresholdDn`), indicating potential oversold conditions.
- Sell conditions are determined based on whether the RSI crosses above the upper threshold (`myThresholdUp`), indicating potential overbought conditions.
- The choice of buy and sell conditions can be toggled using the `Imverse Algorithm` parameter.
4. **Position Tracking**:
- The indicator maintains a variable `myPosition` to track the current position (buy or sell) based on the generated signals.
- If a buy signal occurs (`buy` condition is true), `myPosition` is set to 0. If a sell signal occurs (`sell` condition is true) or the previous position was a buy, `myPosition` is set to 1. Otherwise, `myPosition` remains unchanged.
5. **Visualization**:
- Buy and sell signals are plotted on the chart using shapes (`plotshape`) based on the `myLineToggle` and `myLabelToggle` parameters.
- Lines are drawn on the chart to visually represent buy and sell signals.
- Labels are placed on the chart indicating buy and sell signals.
6. **Alerts**:
- The indicator provides alerts for buy and sell signals using the `alertcondition` function.
Overall, this indicator aims to provide traders with signals based on RSI movements, helping them identify potential buying and selling opportunities in the market. The flexibility in parameters allows users to customize the indicator based on their trading preferences and strategies.
Kzx | RSI + Div + MACDComponents Description:
Relative Strength Index (RSI):
Purpose: Measures the magnitude of recent price changes to evaluate overbought or oversold conditions in the price of a stock or other asset.
Implementation: The script allows users to set the length of the RSI calculation and defines overbought and oversold levels, which can be visually represented on the chart. Additional features include options to fill and/or color the background of the chart when overbought or oversold levels are reached.
Divergence (Div):
Purpose: Identifies instances where the price of an asset is moving in the opposite direction of a momentum indicator, such as the RSI in this script. Divergences can signal potential trend reversals.
Implementation: The script provides options for users to define the conditions under which divergences are identified, including the source of price tops/bottoms, detection limits, and the maximum lookback period for divergence analysis. It visually highlights these divergences on the chart.
Moving Average Convergence Divergence (MACD):
Purpose: Tracks the relationship between two moving averages of a security's price. The MACD is used to identify trend direction, momentum, and potential reversal points through crossovers.
Implementation: The script calculates the MACD line and its signal line. It plots buy or sell markers based on crossovers between these two lines, indicating potential entry or exit points.
Script Category:
Category: Technical Analysis / Indicators and Strategies
Subcategory: Oscillators (for RSI and MACD) and Trend Analysis (for Divergence)
Usage:
The script is designed for traders and analysts who rely on technical analysis to make informed decisions in the financial markets. By integrating RSI, divergence detection, and MACD analysis into a single script, users can gain a more nuanced understanding of market conditions, potentially improving their trading strategies.
Customization and Visualization:
Users can customize various parameters, including lengths for RSI and MACD, overbought/oversold levels, divergence detection criteria, and visual aspects like colors and marker sizes.
The script provides visual cues directly on the price chart, making it easy to spot potential buy/sell signals, overbought/oversold conditions, and divergences without the need to switch between different indicators.

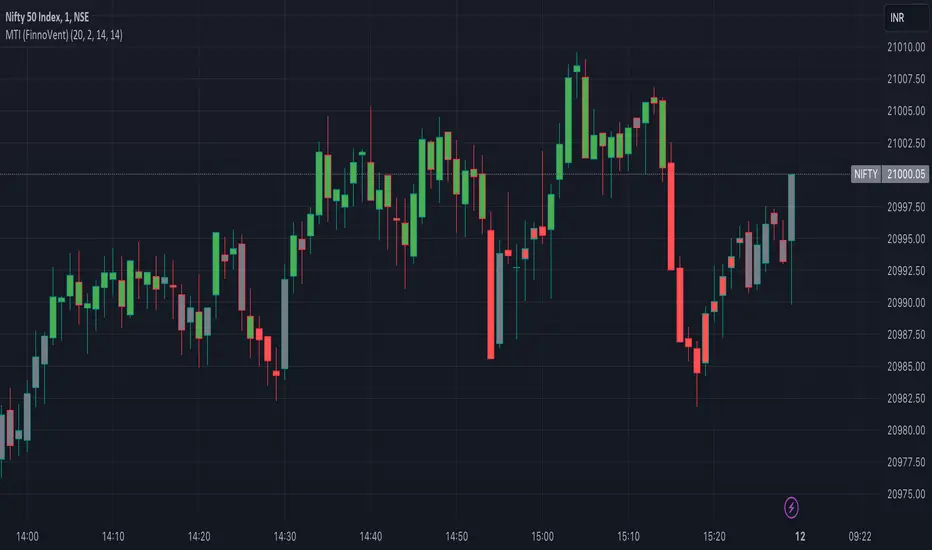
Market Trend Indicator (FinnoVent)The Market Trend Indicator (FinnoVent) is a comprehensive trading tool designed to provide clear visual cues for market trends on TradingView charts. This indicator combines the principles of Exponential Moving Averages (EMAs), Bollinger Bands, the Average Directional Index (ADX), and the Relative Strength Index (RSI) to offer a nuanced view of market movements.
How It Works:
Trend Identification with EMAs: The indicator uses two EMAs (3-period and 30-period) to identify the primary trend. An upward trend is signaled when the 3-period EMA crosses above the 30-period EMA, while a downward trend is indicated when the 3-period EMA crosses below the 30-period EMA.
Sideways Market Detection: To identify sideways trends, the indicator employs Bollinger Bands, ADX, and RSI. A sideways (or consolidating) market condition is identified when:
The price is between the middle 60% of the Bollinger Bands (avoiding the top and bottom 20%).
The ADX is below 30, indicating a lack of a strong trend.
The RSI is between 40 and 60, suggesting a neutral market momentum.
Visual Representation:
Bar Colors: The indicator colors the price bars on the chart based on the identified trend:
Green Bars: Indicate an upward trend.
Red Bars: Indicate a downward trend.
Grey Bars: Indicate a sideways or consolidating market.
How to Use:
Trend Following: Use the colored bars as a guide for trend following. Green bars suggest a potential entry for a long position, while red bars may indicate opportunities for short positions.
Sideways Market Caution: Grey bars signal a sideways market. In such conditions, traders might exercise caution and avoid trend-following strategies, as the market lacks a clear direction.
Complementary Analysis: While the Market Trend Indicator (FinnoVent) provides valuable insights, it's recommended to use it in conjunction with other forms of analysis (like fundamental analysis, other technical indicators, or price action) for comprehensive decision-making.
Suitable for: This indicator is versatile and can be applied to various timeframes and trading instruments, including stocks, forex, commodities, and indices.
Important Notes:
The indicator is designed to minimize repainting but always consider the latest data for the most accurate analysis.
Like all indicators, it is not foolproof. It works best when combined with a solid trading plan and risk management strategies.
Trend-based Price Action StrategyThis is a strategy script that combines trend-based price action analysis with the Relative Strength Index (RSI) and Exponential Moving Averages (EMA) as trend filters. Here's a summary of the key components and logic:
Price Action Candlestick Patterns:
Bullish patterns: Engulfing candle and Morning Star.
Bearish patterns: Engulfing candle and Evening Star.
RSI Integration:
RSI is used to identify overbought and oversold conditions.
EMA Trend Filter:
Three EMAs with different periods: Fast , Medium and Slow.
Long trend condition occur when the fast EMA is above the medium and the medium is above the slow EMA.
Short trend condition occur when the slow EMA is above the medium and the medium is above the fast EMA.
Long entry conditions: RSI is oversold, RSI is decreasing, bullish candlestick pattern, and EMA trend filter conditions are met.
Short entry conditions: RSI is overbought, RSI is decreasing, bearish candlestick pattern, and EMA trend filter conditions are met.
Exit conditions:
Take profit or stop loss is reached.
Plotting:
Signals are plotted on the chart when entry conditions are met.
EMAs are plotted when the EMA trend filter is enabled.
This script aims to capture potential trend reversal points based on a combination of candlestick patterns, RSI, and EMA trend analysis.
Traders can use this script as a starting point for further customization or as a reference for developing their own trading strategies. It's important to note that past performance is not indicative of future results, and thorough testing and validation are recommended before deploying any trading strategy.

RMI Trend SniperThe "RMI Trend Sniper" is a powerful trend-following indicator designed to help traders identify potential buy and sell signals in the market.
It combines elements of the Relative Strength Index (RSI) and the Money Flow Index (MFI) to provide a comprehensive view of market momentum and strength.
🔷 Key Features:
🔹 Customizable Settings : Tailor the indicator to your trading preferences with customizable input parameters, including RSI and MFI lengths, threshold levels, and visual settings.
🔹 Momentum Signals : The indicator generates clear bullish and bearish momentum signals, allowing you to spot potential trend reversals or continuations.
🔹 The positive condition considers the previous RMI value, current RMI value, and positive change in the 5-period exponential moving average (EMA) of the closing price.
🔹 The negative condition looks at the current RMI value and negative change in the 5-period EMA.
🔹 Visual Bands : Visualize market volatility with dynamically plotted bands around the Range Weighted Moving Average (RWMA), providing insights into potential price fluctuations.
🔹 Candlestick Coloring : Easily identify bullish and bearish conditions with color-coded candlesticks, helping you make informed trading decisions.
The "RMI Trend Sniper" is a versatile tool suitable for traders of all experience levels. Whether you are a novice or an experienced trader, this indicator can help you enhance your technical analysis and improve your trading strategies.

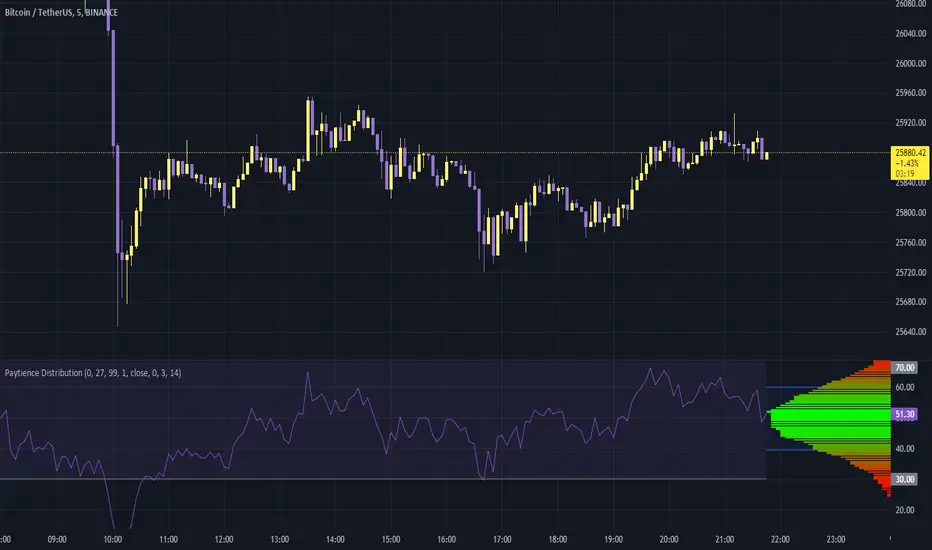
Paytience DistributionPaytience Distribution Indicator User Guide
Overview:
The Paytience Distribution indicator is designed to visualize the distribution of any chosen data source. By default, it visualizes the distribution of a built-in Relative Strength Index (RSI). This guide provides details on its functionality and settings.
Distribution Explanation:
A distribution in statistics and data analysis represents the way values or a set of data are spread out or distributed over a range. The distribution can show where values are concentrated, values are absent or infrequent, or any other patterns. Visualizing distributions helps users understand underlying patterns and tendencies in the data.
Settings and Parameters:
Main Settings:
Window Size
- Description: This dictates the amount of data used to calculate the distribution.
- Options: A whole number (integer).
- Tooltip: A window size of 0 means it uses all the available data.
Scale
- Description: Adjusts the height of the distribution visualization.
- Options: Any integer between 20 and 499.
Round Source
- Description: Rounds the chosen data source to a specified number of decimal places.
- Options: Any whole number (integer).
Minimum Value
- Description: Specifies the minimum value you wish to account for in the distribution.
- Options: Any integer from 0 to 100.
- Tooltip: 0 being the lowest and 100 being the highest.
Smoothing
- Description: Applies a smoothing function to the distribution visualization to simplify its appearance.
- Options: Any integer between 1 and 20.
Include 0
- Description: Dictates whether zero should be included in the distribution visualization.
- Options: True (include) or False (exclude).
Standard Deviation
- Description: Enables the visualization of standard deviation, which measures the amount of variation or dispersion in the chosen data set.
- Tooltip: This is best suited for a source that has a vaguely Gaussian (bell-curved) distribution.
- Options: True (enable) or False (disable).
Color Options
- High Color and Low Color: Specifies colors for high and low data points.
- Standard Deviation Color: Designates a color for the standard deviation lines.
Example Settings:
Example Usage RSI
- Description: Enables the use of RSI as the data source.
- Options: True (enable) or False (disable).
RSI Length
- Description: Determines the period over which the RSI is calculated.
- Options: Any integer greater than 1.
Using an External Source:
To visualize the distribution of an external source:
Select the "Move to" option in the dropdown menu for the Paytience Distribution indicator on your chart.
Set it to the existing panel where your external data source is placed.
Navigate to "Pin to Scale" and pin the indicator to the same scale as your external source.
Indicator Logic and Functions:
Sinc Function: Used in signal processing, the sinc function ensures the elimination of aliasing effects.
Sinc Filter: A filtering mechanism which uses sinc function to provide estimates on the data.
Weighted Mean & Standard Deviation: These are statistical measures used to capture the central tendency and variability in the data, respectively.
Output and Visualization:
The indicator visualizes the distribution as a series of colored boxes, with the intensity of the color indicating the frequency of the data points in that range. Additionally, lines representing the standard deviation from the mean can be displayed if the "Standard Deviation" setting is enabled.
The example RSI, if enabled, is plotted along with its common threshold lines at 70 (upper) and 30 (lower).
Understanding the Paytience Distribution Indicator
1. What is a Distribution?
A distribution represents the spread of data points across different values, showing how frequently each value occurs. For instance, if you're looking at a stock's closing prices over a month, you may find that the stock closed most frequently around $100, occasionally around $105, and rarely around $110. Graphically visualizing this distribution can help you see the central tendencies, variability, and shape of your data distribution. This visualization can be essential in determining key trading points, understanding volatility, and getting an overview of the market sentiment.
2. The Rounding Mechanism
Every asset and dataset is unique. Some assets, especially cryptocurrencies or forex pairs, might have values that go up to many decimal places. Rounding these values is essential to generate a more readable and manageable distribution.
Why is Rounding Needed? If every unique value from a high-precision dataset was treated distinctly, the resulting distribution would be sparse and less informative. By rounding off, the values are grouped, making the distribution more consolidated and understandable.
Adjusting Rounding: The `Round Source` input allows users to determine the number of decimal places they'd like to consider. If you're working with an asset with many decimal places, adjust this setting to get a meaningful distribution. If the rounding is set too low for high precision assets, the distribution could lose its utility.
3. Standard Deviation and Oscillators
Standard deviation is a measure of the amount of variation or dispersion of a set of values. In the context of this indicator:
Use with Oscillators: When using oscillators like RSI, the standard deviation can provide insights into the oscillator's range. This means you can determine how much the oscillator typically deviates from its average value.
Setting Bounds: By understanding this deviation, traders can better set reasonable upper and lower bounds, identifying overbought or oversold conditions in relation to the oscillator's historical behavior.
4. Resampling
Resampling is the process of adjusting the time frame or value buckets of your data. In the context of this indicator, resampling ensures that the distribution is manageable and visually informative.
Resample Size vs. Window Size: The `Resample Resolution` dictates the number of bins or buckets the distribution will be divided into. On the other hand, the `Window Size` determines how much of the recent data will be considered. It's crucial to ensure that the resample size is smaller than the window size, or else the distribution will not accurately reflect the data's behavior.
Why Use Resampling? Especially for price-based sources, setting the window size around 500 (instead of 0) ensures that the distribution doesn't become too overloaded with data. When set to 0, the window size uses all available data, which may not always provide an actionable insight.
5. Uneven Sample Bins and Gaps
You might notice that the width of sample bins in the distribution is not uniform, and there can be gaps.
Reason for Uneven Widths: This happens because the indicator uses a 'resampled' distribution. The width represents the range of values in each bin, which might not be constant across bins. Some value ranges might have more data points, while others might have fewer.
Gaps in Distribution: Sometimes, there might be no data points in certain value ranges, leading to gaps in the distribution. These gaps are not flaws but indicate ranges where no values were observed.
In conclusion, the Paytience Distribution indicator offers a robust mechanism to visualize the distribution of data from various sources. By understanding its intricacies, users can make better-informed trading decisions based on the distribution and behavior of their chosen data source.
Trend Analyser by Abdul KhaderThis indicator is designed to provide buy and sell signals based on a combination of technical analysis methods. It uses the Relative Strength Index (RSI), Moving Average Convergence Divergence (MACD), and Exponential Moving Averages (EMA) to generate signals. It also calculates Stop Loss (SL) and Take Profit (TP) levels based on the Average True Range (ATR).
Components:
RSI: An oscillator that measures the speed and change of price movements. RSI is used to identify overbought and oversold conditions. In this indicator, an RSI below 30 is considered oversold and an RSI above 70 is considered overbought.
MACD: A trend-following momentum indicator that shows the relationship between two moving averages of a security’s price. The MACD triggers technical signals when it crosses above (to buy) or below (to sell) its signal line.
EMA: These moving averages give more weight to recent prices and are used to identify short-term price trends. A crossover of a shorter period EMA (9 periods in this case) above a longer period EMA (21 periods in this case) generates a buy signal. Conversely, a crossover of the shorter EMA below the longer EMA generates a sell signal.
ATR: This is a market volatility indicator. The ATR is used to calculate Stop Loss and Take Profit levels. These levels are set at a distance from the entry price, equal to a certain multiplier (1.5 in this case) of the ATR.
How to Use:
Buy Signal: A green triangle below the price bar indicates a buy signal. This is generated when the following conditions are met:
The short-term EMA crosses above the long-term EMA
The RSI is below 30 (oversold condition)
The MACD line crosses above the signal line and is above zero
Sell Signal: A red triangle above the price bar indicates a sell signal. This is generated when the following conditions are met:
The short-term EMA crosses below the long-term EMA
The RSI is above 70 (overbought condition)
The MACD line crosses below the signal line and is below zero
Stop Loss and Take Profit: These levels are indicated by dashed lines. The stop loss for a long position is set below the entry price, while the take profit is set above. For a short position, the stop loss is set above the entry price and the take profit is set below.
Important Notes:
This indicator is designed for intraday trading and may not be suitable for longer-term trades.
Always use this indicator in conjunction with other aspects of technical and fundamental analysis. No indicator can provide accurate signals 100% of the time.
Always backtest this indicator with historical data before using it in live trading.
Risk management is crucial in trading. Never risk more than a small percentage of your trading capital on a single trade.
RSI of Zero Lag MA (ValueRay)The RSI of a Zero Lag Moving Average a powerful tool for for reliable exit signals.
The Relative Strength Index (RSI) is a widely recognized momentum oscillator that measures the speed and change of price movements. It provides valuable insights into overbought and oversold conditions, enabling traders to identify potential reversal points and take advantage of market inefficiencies.
The RSI of a Zero Lag Indicator takes this concept a step further by incorporating the Zero Lag Moving Average. The Zero Lag Moving Average is a cutting-edge indicator that minimizes lag and provides a smoother representation of price action, allowing for quicker and more precise responses to market movements.
By combining the RSI with the Zero Lag Moving Average, this indicator offers traders a superior exit strategy. When the RSI reaches extreme levels of overbought or oversold conditions, it indicates a potential reversal in the market. The Zero Lag Moving Average further enhances this signal by reducing delays and providing timely exit points.
Moreover, the RSI of a Zero Lag Indicator is not limited to mean reversion strategies. While it excels in identifying mean reversion opportunities, it can also be used in conjunction with other trading approaches. Traders can take advantage of its objective signals to exit trades profitably, regardless of their chosen strategy.
With its ability to accurately pinpoint overbought and oversold conditions, the RSI of a Zero Lag Indicator offers traders a competitive edge in the market. By providing timely exit signals and minimizing lag, it helps traders optimize their trading decisions and increase their chances of success.

RSI TrueLevel StrategyThis strategy is a momentum-based strategy that uses the Relative Strength Index (RSI) indicator and a TrueLevel envelope to generate trade signals.
The strategy uses user-defined input parameters to calculate TrueLevel envelopes for 14 different lengths. The TrueLevel envelope is a volatility-based technical indicator that consists of upper and lower bands. The upper band is calculated by adding a multiple of the standard deviation to a linear regression line of the price data, while the lower band is calculated by subtracting a multiple of the standard deviation from the same regression line.
The strategy generates long signals when the RSI crosses above the oversold level or when the price crosses above the selected lower band of the TrueLevel envelope. It generates short signals when the RSI crosses below the overbought level or when the price crosses below the selected upper band of the TrueLevel envelope.
The strategy allows for long and short trades and sets the trade size as a percentage of the account equity. The colors of the bands and fills are also customizable through user-defined input parameters.
In this strategy, the 12th TrueLevel band was chosen due to its ability to capture significant price movements while still providing a reasonable level of noise reduction. The strategy utilizes a total of 14 TrueLevel bands, each with varying lengths. The 12th band, with a length of 2646, strikes a balance between sensitivity to market changes and reducing false signals, making it a suitable choice for this strategy.
RSI Parameters:
In this strategy, the RSI overbought and oversold levels are set at 65 and 40, respectively. These values were chosen to filter out more noise in the market and focus on stronger trends. Traditional RSI overbought and oversold levels are set at 70 and 30, respectively. By raising the oversold level and lowering the overbought level, the strategy aims to identify more significant trend reversals and potential trade opportunities.
Of course, the parameters can be adjusted to suit individual preferences.

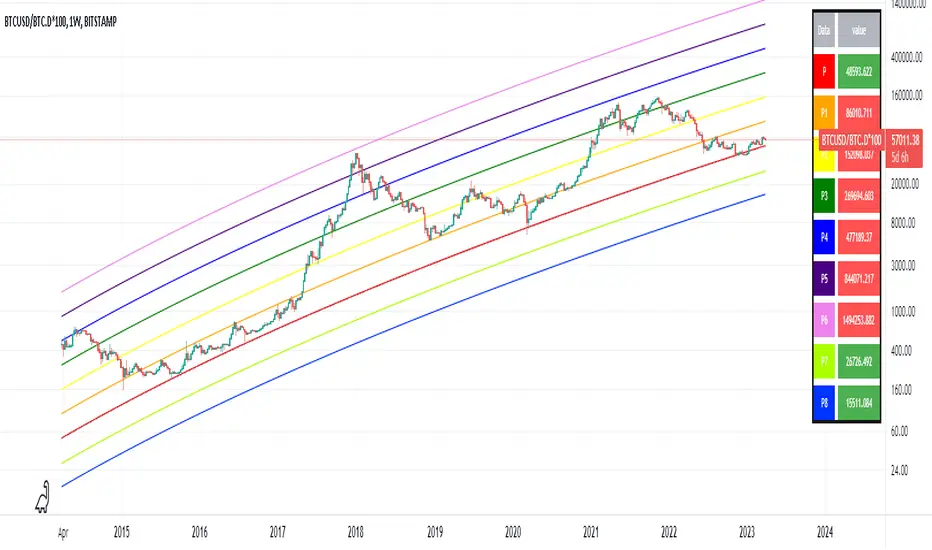
Optimized Logarithmic Curve for Bitcoin (BTC/USD) by FICASHello everyone!
I'd like to share with you a handy tool that is incredibly useful for analyzing Bitcoin's price movements. This optimized logarithmic curve indicator is a refined version of the popular "My BTC log curve" indicator, originally created by @quantadelic.
We have made several improvements to enhance its predictive capabilities when it comes to identifying potential price bottoms for Bitcoin BTC/USD.
Description:
In this detailed analysis, we are excited to introduce you to an optimized version of the popular "My BTC log curve" indicator, originally created by @quantadelic. We have refined the indicator for enhanced predictive capabilities when it comes to identifying potential price bottoms for Bitcoin BTC/USD. By putting ourselves in the reader's shoes, we aim to provide a comprehensive and meaningful explanation of our analysis and predictions using this improved tool.
The logarithmic curve is a powerful tool for analyzing price movements in a non-linear fashion, allowing traders and investors to identify critical turning points and trends. With the optimized logarithmic curve, we can more accurately predict potential price bottoms, ultimately guiding better-informed trading and investment decisions.
Key Features of the Optimized Logarithmic Curve:
Improved predictive capabilities: The refined logarithmic curve has been optimized to provide more accurate predictions of potential price bottoms, enabling traders to make better-informed decisions.
Enhanced visualization: The optimized curve offers a clearer visual representation of Bitcoin's price movements, making it easier for traders to identify patterns and trends.
Adaptability: This indicator can be applied to various timeframes, providing insights for both short-term and long-term traders.
The optimized logarithmic curve indicator is based on a logarithmic regression of the USD price of Bitcoin, calculated according to the equation:
y = A * exp(beta * x^lambda + c) + m * x + b
where x is the number of days since the genesis block. All parameters are editable in the script options, allowing traders to customize the curve to their preferences.
Here are some of the key changes made to the original indicator to create the optimized logarithmic curve:
Midline Calculation: The optimized logarithmic curve utilizes an updated method for calculating the midline, which better represents the average price movement of Bitcoin over time. This improved midline calculation provides a more accurate representation of Bitcoin's historical price trajectory, making it easier to identify potential price bottoms.
Cross Line Calculation: We have modified the way cross lines are calculated in the optimized logarithmic curve. These new cross lines are derived from a combination of the updated midline calculation and historical support and resistance levels. This change allows traders to more accurately identify critical points in the market where price action is likely to reverse or continue its trend.
Table Display: a powerful visualization tool designed to provide a comprehensive overview of the relationships between various exponential curves and the Bitcoin price. This table display, integrated into the "FiCAS BTC log curve" indicator, enables traders and analysts to quickly compare and assess the impact of these curves on the market.
Our analysis using the optimized logarithmic curve suggests that Bitcoin might be at a critical price bottom, indicating that selling at this point may not be the most prudent course of action. Instead, traders and investors could consider taking advantage of the potential upswing as the market moves away from the identified price bottom.
Key highlights of this Optimized Logarithmic Curve for Bitcoin (BTC/USD) by FICAS:
Custom Pine Script: Pinescript code serves as the backbone of this strategy, providing a strong foundation for identifying potential opportunities based on the relationships between exponential curves and Bitcoin price.
MACD Indicator: The Moving Average Convergence Divergence (MACD) is integrated to help traders recognize trend reversals, bullish or bearish market conditions, and potential entry or exit points.
Momentum Indicator: By incorporating the Momentum (10, close) indicator, traders can identify the strength of price movements and potential trend continuations or reversals.
RSI and SMA: The Relative Strength Index (RSI) is used to assess overbought or oversold conditions, while the Simple Moving Average (SMA) with a period of 14 and an applied factor of 2 smoothens the data for better trend identification.
IMPORTANT:
While this indicator can be applied to traditional BTC/USD charts, we highly recommend using it on the following chart for optimal results in identifying price bottoms:
BITSTAMP:BTCUSD / CRYPTOCAP:BTC.D * 100
By employing the optimized logarithmic curve indicator on the recommended chart, traders can gain a more accurate perspective on potential price bottoms, leading to improved decision-making.
In conclusion, the optimized logarithmic curve indicator provides valuable insights into Bitcoin's price movements, allowing traders and investors to make more informed decisions. We encourage you to test this refined tool and share your thoughts in the comments section. Special thanks to @quantadelic, the first creator of this indicator, for inspiring us to develop this optimized version. If you have any questions or require further clarification, please feel free to ask. Wishing you success in your trading and investment endeavors!
Please ensure you understand and abide by the TradingView House Rules when using this indicator: www.tradingview.com